Business Intelligence
Visualization and research of a business data
Visualisation
convert the numbers to graphs and diagrams, to see the trends
Past
how has your business grown, to see the peaks and falls
Now
what’s going on in your company today

Future
where will your business be tomorrow, what expectations and issues
Decisions
data caused business decisions
How it works
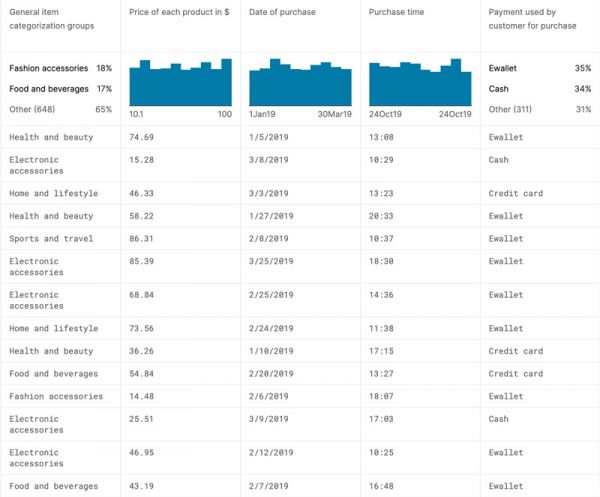
You have a business. There is a cash register. We collecting data from it. Then we analyze dates, time, money, goods, and a lot of other data. Graphs, diagrams after.
As a result, you’ll know:
• identification of optimal locations for new points
• increase of sales
• warehouse optimization
• increase of the average check
• identification of weak/strong points and causes of weakness/strength
• goods-locomotives and goods-satellites
• optimal time
• competitive analysis
• predictive sales analysis for each product
• portrait of the buyer, his behavior, preferences, taste and use of this information to optimize sales